Continuing our efforts in the GDSC7 challenge this week, the organizers have tasked us with enhancing our agent system enabling it to generate charts based on user questions and display them within responses. Since our system supports markdown formatting for visuals, we must store these images externally and include a public link in our markdown responses. The organizers suggest using an AWS S3 bucket for this storage solution.
We have at least two questions that were designed to test the chart feature:
- Show a plot of the correlation of a countries GDP and its readings skills according to the PIRLS 2021 study
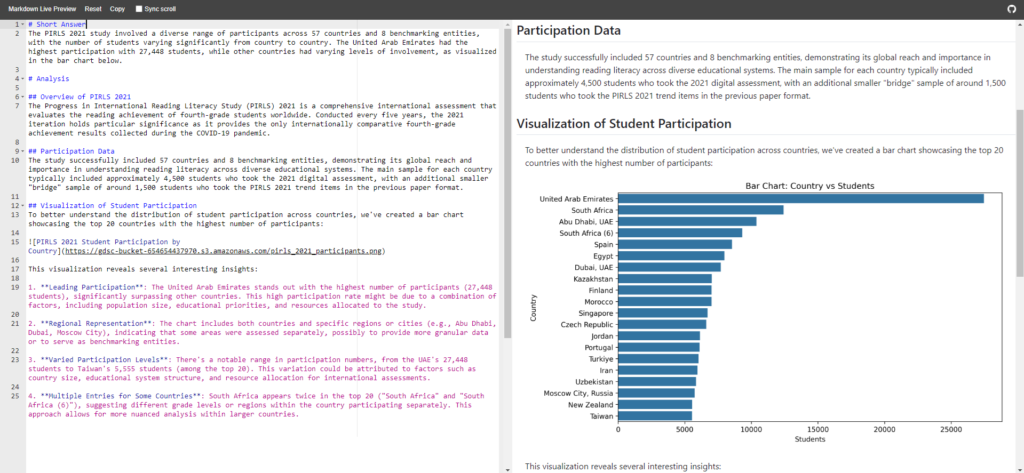
- Visualize the number of students who participated in the PIRLS 2021 study per country
To address both questions, the agent system must retrieve information from the provided database and, for the first question, gather GDP data from an external source. After collecting the necessary data, the system have to create a chart to include in the response. As discussed in previous posts, we have already implemented several features in our agent system:
- Text-to-SQL Agents in Relational Databases with CrewAI
- Enhancing Relational Database Agents with Retrieval Augmented Generation (RAG)
- Adding site and video as sources for CrewAI agent system
At this point, search in the database and external sources are already in our set of dominated skills. Let’s do the next step.
Chart creation tool
There are several ways to integrate this new feature into our system. One option is to create a new agent that generates Python programs to create charts and save them to S3. However, I like to keep things simple. We can enhance our existing agent by adding a tool that generalizes the chart creation process. Remember, we already have the data as context, and our previous features can retrieve all necessary information. Our main task now is to focus on chart creation.
I chose to create the new tool in new file named chart.py. This tool takes several input parameters: the chart type (bar, scatter, or line), data (in JSON format), filename, and the x and y axes. The interaction with S3 is handled using the boto3 package. We retrieve the session and create an S3 client to upload the chart image.
import boto3.session
from crewai_tools import tool
import json
import pandas as pd
import matplotlib.pyplot as plt
import seaborn as sns
from typing import Literal
import boto3
import os
import io

@tool('generate_chart')
def generate_chart(chart_type: Literal['scatter','line','bar'], data_json: str, filename: str, x_axis: str, y_axis: str) -> str:
    """
    Generate a Seaborn chart based on input data and save it as an image file.

    In bar chart, prioritize passing string column as the y-axis.

    This function creates a chart using Seaborn and matplotlib, based on the specified
    chart type and input data. The resulting chart is saved as an image file.

    Parameters:
    -----------
    chart_type : Literal['scatter', 'line', 'bar']
        The type of chart to generate. Must be one of 'scatter', 'line', or 'bar'.
    data_json : str
        A JSON string containing the data to be plotted. The JSON should be structured
        such that it can be converted into a pandas DataFrame.
    filename : str
        The name of the file (including path if necessary) where the chart image will be saved.
    x_axis : str
        The name of the column in the data to be used for the x-axis.
    y_axis : str
        The name of the column in the data to be used for the y-axis.

    Returns:
    --------
    str
        A message confirming that the chart has been saved, including the filename.

    """

    # Convert JSON input to a pandas DataFrame
    data = json.loads(data_json)
    df = pd.DataFrame(data)

    # Create the Seaborn plot
    plt.figure(figsize=(10, 6))
    if chart_type == "scatter":
        sns.scatterplot(data=df, x=x_axis, y=y_axis)
    elif chart_type == "line":
        sns.lineplot(data=df, x=x_axis, y=y_axis)
    elif chart_type == "bar":
        sns.barplot(data=df, x=x_axis, y=y_axis)
    else:
        raise ValueError(f"Unsupported chart type: {chart_type}")

    # Set labels
    plt.xlabel(x_axis)
    plt.ylabel(y_axis)
    plt.title(f"{chart_type.capitalize()} Chart: {y_axis} vs {x_axis}")

    # Save the plot to a BytesIO object
    img_data = io.BytesIO()
    plt.savefig(img_data, format='png', dpi=300, bbox_inches='tight')
    plt.close()

    # Reset the pointer of the BytesIO object
    img_data.seek(0)

    # Upload the image to S3
    session = boto3.Session()
    s3 = session.client('s3')
    bucket_name = '<YOUR_S3_BUCKET_NAME_HERE>'
    try:
        s3.upload_fileobj(img_data, bucket_name, filename)
        # Build and return the S3 URL
        s3_url = f'https://{bucket_name}.s3.amazonaws.com/{filename}'
        return s3_url
    except Exception as e:
        return f"An error occurred: {str(e)}"
After that you just need to equip the new tool in your agent/task to enable your system to create, store charts in S3 and use it in the answers.
    #(...)
    @task
    def answer_question_task(self) -> Task:
        t = Task(
            config=self.tasks_config['answer_question_task'],
            agent=self.writer_agent(),
            tools=[
                chart_tools.generate_chart,
            ]
        )
        return t
     #(...)
Not a rocket science, right? Look at the results:

I hope you find it useful. Happy coding!!
